1
The pictogram below shows the number of cars and lorries in towns P and Q.
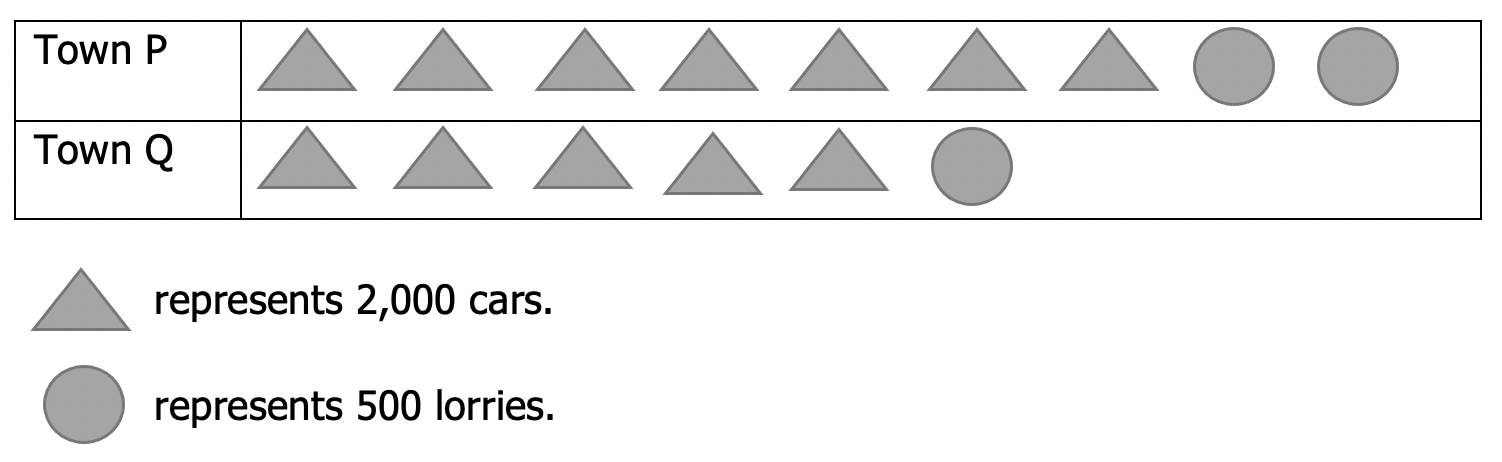
The ratio of the number of vehicles in town P to the number of cars in town Q is
-
- 3 : 2
-
- 5 : 2
-
- 7 : 5
-
- 10 : 7